
When I wrote Middle Leadership Mastery I had to make decisions about how much detail to include. These expansion packs aimed to fill in some background details that might help you. If you have any suggestions of what to expand on then please let me know. Cheers, Adam.
In the assessment chapter in Middle Leadership Mastery (MLM) I discuss how we can make more sense of our assessment systems. A problem I have found is that very little is understood about assessment. I say this knowing that, until recently, I was also in this category. This is not surprising considering assessment theory is never specifically taught in teacher training and there is a general lack of training opportunities in schools. Often there is an abundance of certainty about assigning grades to internal assessments. These grades are innocuous until you start using them to make decisions. That is where they can lead you astray.
If you haven’t read the book I would recommend buying it to learn more about the consequences of assessment decisions on the inferences you can make. I’ve also recommended some other resources you can use to improve your understanding of assessment. You’ll find them at the bottom of the blog.
I want to point out that I am not declaring myself an assessment expert, but I hope you find this helpful. If you are an assessment expert and you feel I have made errors please correct me. My aim is to increase the dialogue on assessment within the teaching community.
In this blog I want to extend what I wrote in MLM and go into more detail on two areas:
- Why percentages are not a good measure of student performance
- Why standardised scores can go some way to improve on their weaknesses
Why percentages are not a good measure of student performance
For this idea let’s consider 4 students result in an 100 mark test whereby the cohort average was 50.
| Student | Score |
| A | 55 |
| B | 60 |
| C | 90 |
| D | 95 |
Consider student A, What does their 55% really tell us? Well it tells us they are above average, but does it tell us how good they are? If I was to assign a grade could I do that? Did they perform 10% better than the average student?
Student B scored 60. How much better are they than Student A?
It is our instinct to assume that an increase of 5 marks performance in each student’s result is equal because we think of percentages as linear in nature.
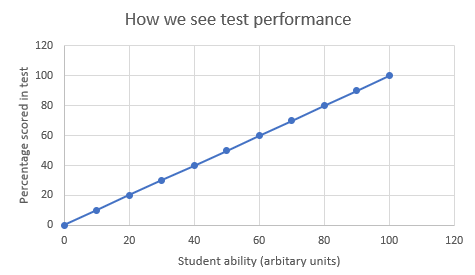
Unfortunately, when they come to assessment they are not. You see the faulty assumption is that all of student ability can be represented on a scale of 0-100. In reality some students are exponentially more able than others. To make the test linear we would need an incredibly long test that assesses adaptively to ensure that the more questions you got right the more demanding the questions became. This kind of assessment is not often used. As Deep Singh Ghataura say in his researchED home talk “They look simple, they are really easy to calculate…unfortunately If you are going to compress the entire human ability into this really artificial range then you are going to end up with numbers that are non-linear…a students getting 50% in one assessment and 60% in another doesn’t tell you much in of itself, you have to have other information along with it”
So the consequence of this is the difference in ability between Student A and B is less than the difference in ability of Students C and D. The easiest way to think about this is that for B to get 5 more marks than A they just have to know 5 of the 45 remaining marks, there are lots of paths to a successful outcome. Whereas for D to beat C they need to know 5 of the remaining 10 marks, much fewer paths to success.
Standard deviation.
The standard deviation measures the spread of results around the mean in our test if the standard deviation was 5 marks then it would tell us that most students scored between 45 and 55 marks. If my standard deviation is 15 it tells me most of my students scored between 35 and 65. This is because we assume our grade profile creates a normal distribution. If our sample size is large enough this assumption is generally fine. If we only have one class this might be tricky.
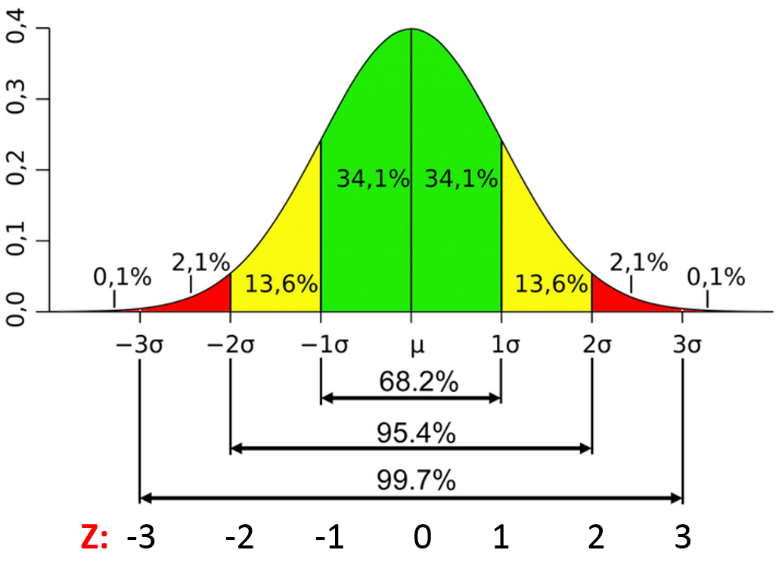
For the sake of convenience I am going to say that my entire cohort sat this test so I have 300 results. This should be a fairly normal distribution. The figure above shows you how the normal distribution is broken up by standard deviations. Essentially in a normal distribution the relationship with the standard deviation is fixed, so 68.2% of all results fall within ± 1 standard deviation. Notice on the diagram how quickly the distribution curves towards 0. By the third SD only 0.1% are left at the top and bottom end. These are truly remarkable students (in both senses of the word) So if It was a SD of 15 then Students D would be in that 0.1% of the population but student C would not. They would be in the top 2.1%. Conversely student A+B both fall within the first SD so are broadly average.
Z scores aka standard scores.
This is all very interesting I’m sure but how useful is it to middle leaders? Luckily there is a way to take into account this information and make it relatively easy to communicate to others; Z scores.
These are used by national KS2 assessments to communicate performance of schools in literacy and maths exams. What they do is they allow us to communicate a student’s performance as a score for their position within the normal distribution. The benefit of this is it allows you to compare the relative performance of different students in the same assessment. This would be difficult using percentages as each test will have a different mean and SD due to the variation in questions. So a 50% score means a different thing each time. Z scores reduce that effect.
Z scores provide a number based on the SD of the distribution. So a score of +1.00 tells you they are 1 SD above the mean and a score of 0.00 tells you they are at the mean. You can see the Z scores below the graph in the picture above.
How to calculate Z scores.
Calculating Z scores is fairly easy using excel or google sheets. This is the equation

𝓧 is your value
μ is the mean
σ is the standard deviation
But excel can do most of the work for you. A simple guide is here.
Do Z scores help me assign grades?
By using Z scores you now have a measure of a students performance compared to the rest of a cohort. If you must assign a grade then this can be done by exploring the grade profile of your subject and matching it to the normal distribution. You might have to consider carefully your cohorts ability profile compared to the national average. You could use the Z score to communicate to students their performance directly. The Z scores provide a better way of distributing the grades you invent than just using percentages because it aims to account for the varying difficulty of each test.
What about measuring progress between tests?
Measuring progress of students between assessments is incredibly hard. In a standard school assessment model the tests will have different content and questions, which makes comparisons hard. If we truly want to measure the progress of students over time we need to build our assessments with anchoring questions of common content that allow for this comparison and use a more sophisticated test like the Rasch model. Then we might be able to make some valid conclusions.
Further reading
Databusting for schools: A Brilliant book on what data really means
Deep Ghataura recorded researchED Haninge session on data. He is the data Yoda to my Wedge Antilles.
Matthew Benyohai has great blogs on assessment.

Leave a comment